


Website Carbon Optimisation
A Blog from Mike Irving, Software Developer
By Mike Irving - Published: 27/5/2024
I was recently made aware of the Website Carbon Calculator, by developer friend Terence Burridge (@CodebunTes), via this Tweet on Twitter.
A day later, in person, we had a good chat about it.
Having, in the distant past now, done a lot in the field of SEO, I'd used similar tools over the years, such as PageSpeed Insights and YSlow.
I was intrigued to see how this tool compared.
PageSpeed Insights, from Google, focuses on many attributes of a web page and how it renders. The goal being to balance the download size, the delivery speed, the render time and effort, suggesting improvements on how to improve these, and how to optimise the content "above the fold" - that is the first screen of content the user will see, mobile or desktop, on request of the web page.
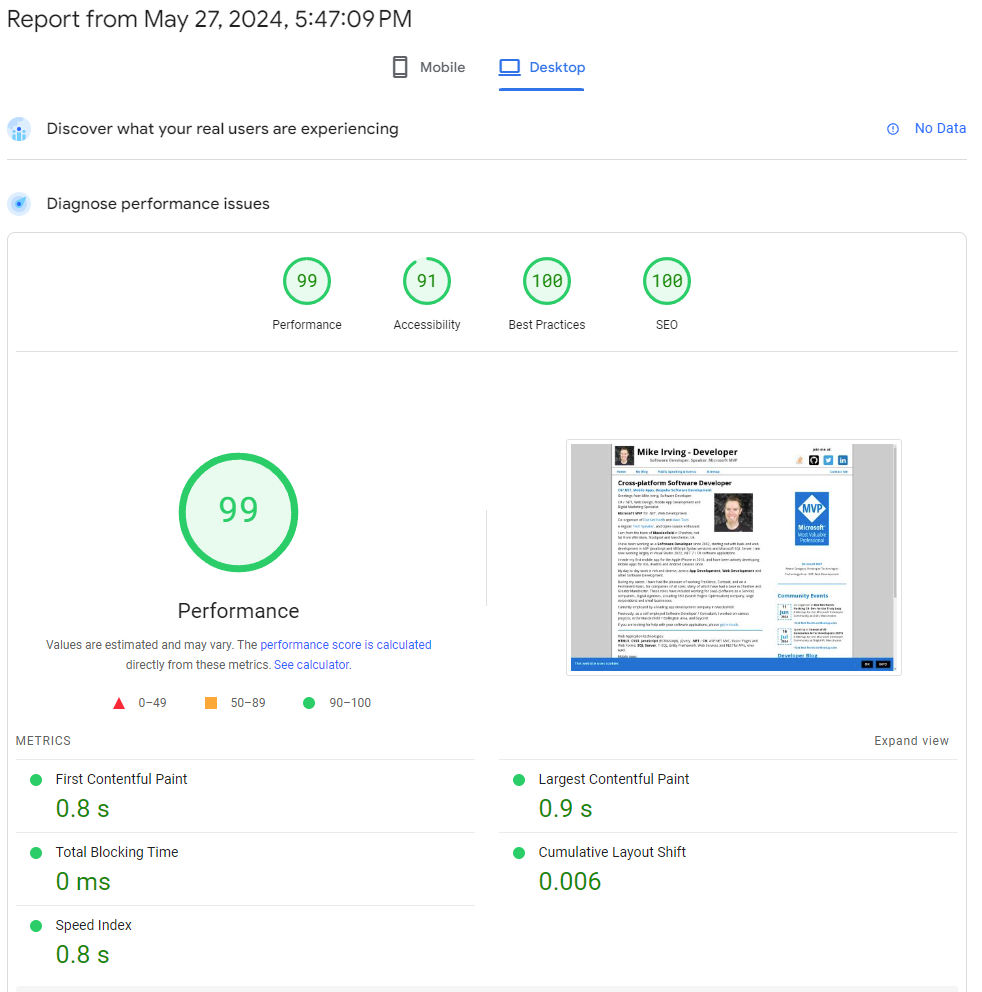
You are scored on 4 main metrics, Performance, Accessibility, Best Practices, and SEO.
The scores will differ for Desktop or Mobile.
Here is a report summary for the home page of this website.
You can see for Desktop, a very respectable score set of 99, 91, 100, 100 is achieved.
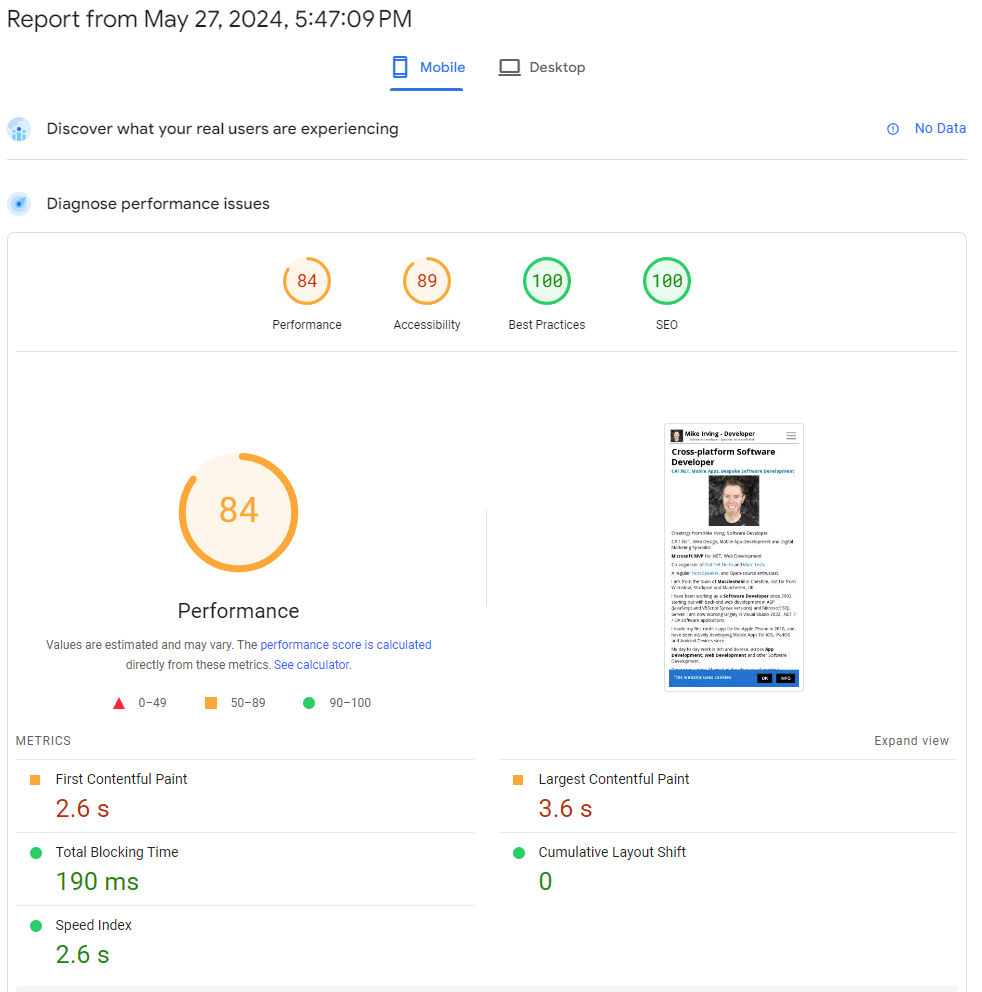
And for Mobile, the scores are 84, 89, 100, 100. Again, pretty decent.
I will endeavour to improve things these tools suggest, and revisit regularly.
PageSpeed Insights lists lots of checks and suggestions, though I'm not going to go into those today, I'm here to look at the Website Carbon Calculator.
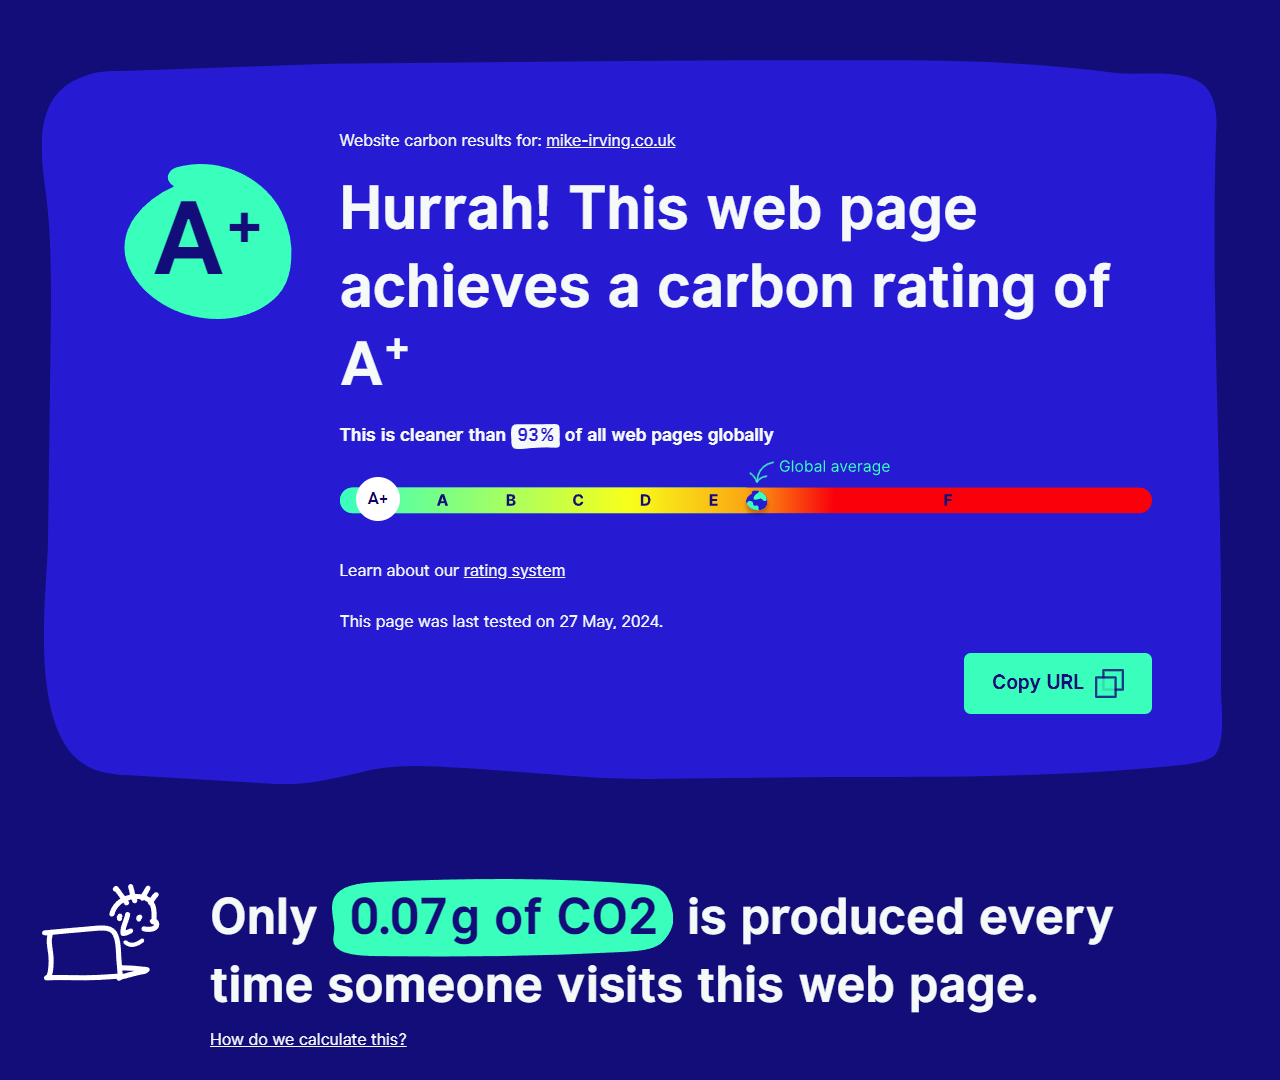
So, let's run my website home page in the Website Carbon Calculator.
The result is great, an A+ Rating, "cleaner than 93% of all web pages globally", and "Only 0.07g of CO₂ is produced every time someone visits this web page".
Take all this with a pinch of salt. It is only the delivery of the frontend being scrutinised here. Lots could be going on, good or bad, server-side, that also needs to be considered.
There is also a look at the server / hosting service you are using. It looks great in my case, the tool reports "This web page appears to be running on sustainable energy". However, this might not be very accurate, or based on blanket assumptions.

My website runs on a Virtual Machine on AWS EC2, which it seems to class as "sustainable energy".
However other sites I have tested, that run on GitHub Pages, report they are running on "bog standard energy".
Again, perhaps a blanket assumption, a "defaults to green / not green" rule for unknown hosts. And yeah, as mentioned, not real insight into the backend effort going on for creation of the particular web page.
So, my website seems pretty good. I'll continue to optimise it. In particular I'd like to get the accessibility rating up.
Lets look at another website..
I thought I'd run the tool against the Macclesfield Hedgehogs website, the web frontend of my .NET, IoT and Hedgehogs! blog and talk series.
The result, not great. an "E" Rating, 0.74g of CO₂ per visit.
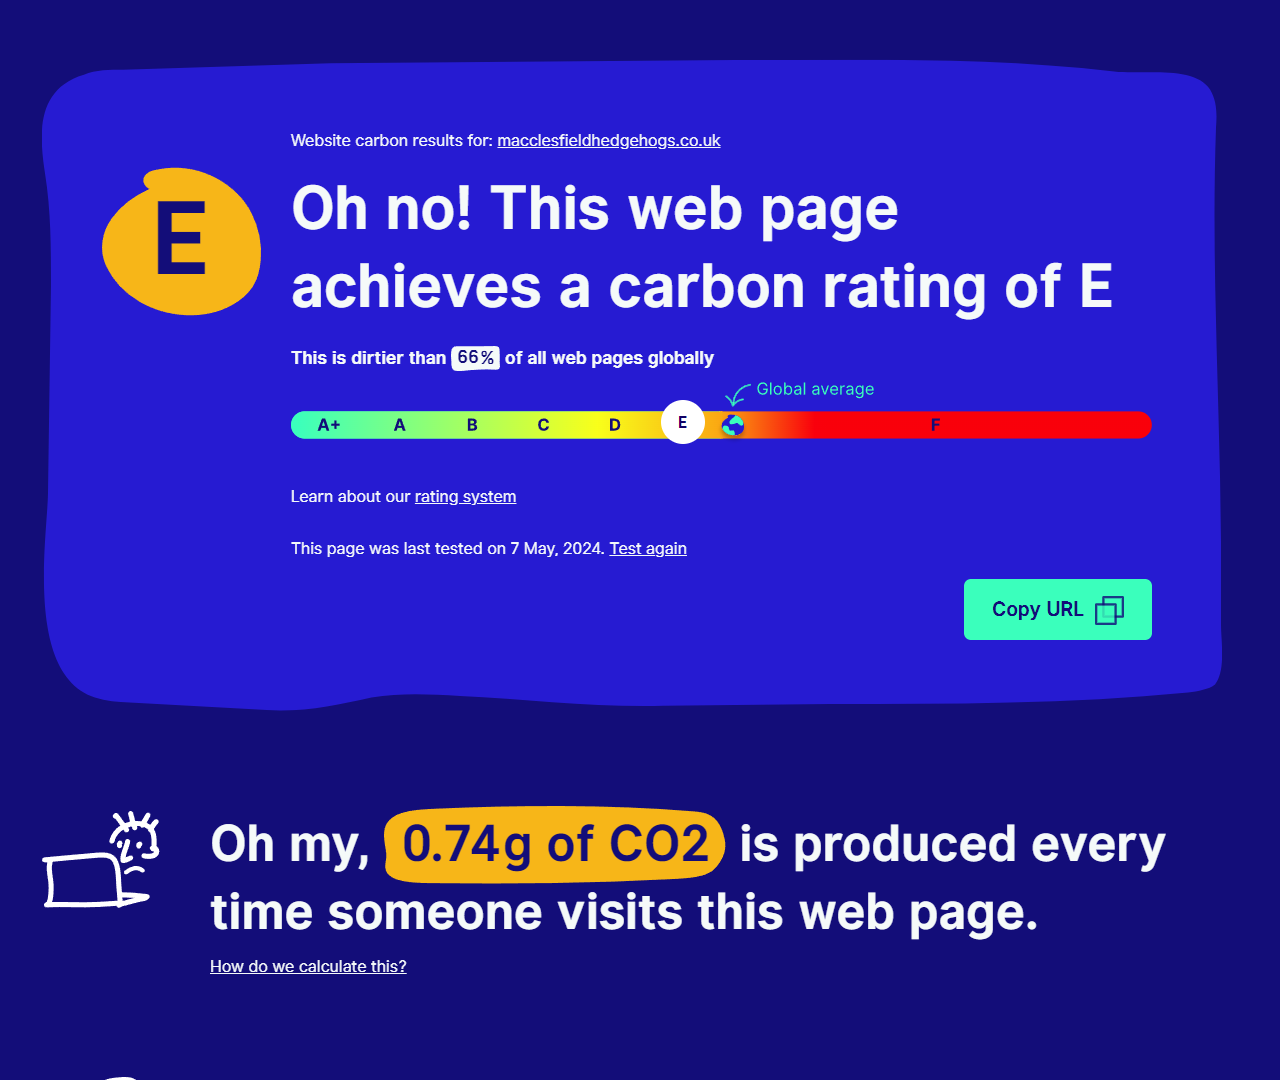
Most of this is to do with the JSON feed of videos used on the site, a single hit really, as the Single Page Application will load it only once. However, I acknowledge it is big, and an "E" doesn't sound great.
Optimisation.
In the time it has taken me to write this blog, I have changed the video feed file.
I have removed an unused field for each entry in the feed, and also removed the URL Prefix, as the website already knows this, and I can prepend this frontend at render time, using JavaScript.
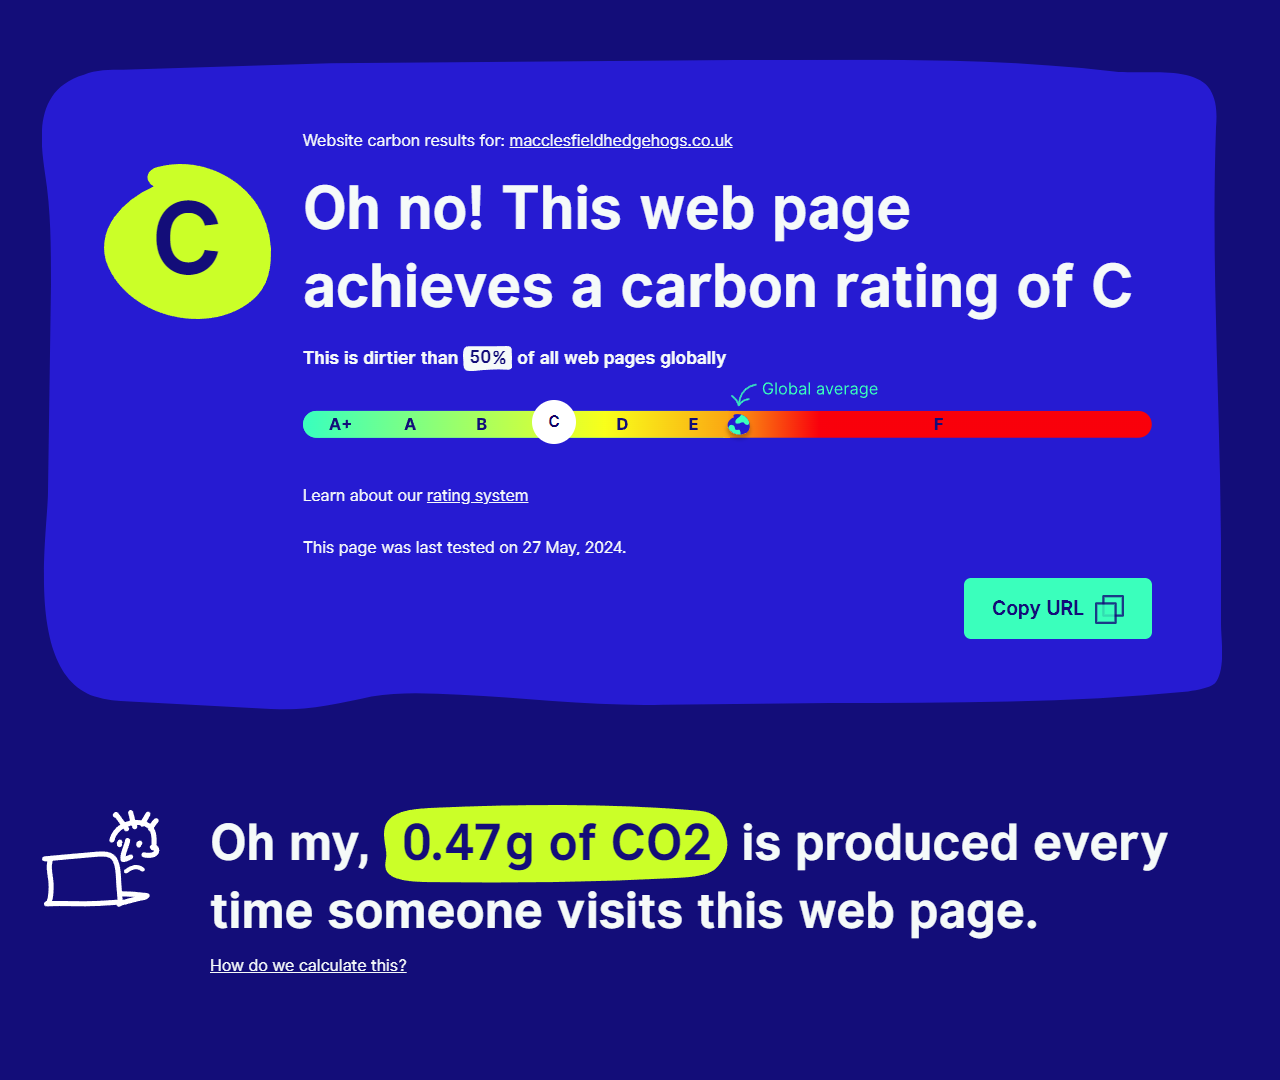
To cut a long story short, with this afternoon's effort, I've flipped figures: the "0.74g of CO₂" is now "0.47g of CO₂", a "C" Rating, better than "50% of all web pages globally". I'm happy with that improvement, as a first pass
This is just the beginning really, with much to do and improve. However, the download speed is quicker, the file size is smaller, and that can only be good for both users and search engines.
The change?
The change was twofold, programmatically.
Firstly, I changed the Serverless Function that generates the feed, hopefully a knock-on effect being a saving of CO₂, compute time and effort in the cloud.
Secondly, I changed the website JavaScript to make use the of the altered feed format, to fix up the video URLs, and was also able to make a few other minor savings in the frontend scripts as I worked on it.
As the website is Open-Source, the changes can be found in this Commit, over on GitHub.
Other changes you can make
For both speed of delivery, size of download, and overall performance improvements, you could also look at such things as:
- Optimising your backend date and page building processes
- Improving your frontend code
- Removing unnecessary HTML / CSS / JavaScript
- Modernising your HTML / CSS / JavaScript
- Compressing and Optimising your Image Files
- Minimising JS and CSS files
- Compressing and caching the delivery of files from your server
If you use IIS on Windows Server, here is an article on Using IIS Compression on Microsoft Learn.
In summary
I'd love to further improve the Macclesfield Hedgehogs website carbon rating, and I'll be working on other websites soon too.
I hope you have enjoyed reading about the process.
Go test your web pages today, see how they perform, and then set to work on how you can improve them.
Additional reading: Azure sustainability
View Blog Entries...
Page: 1, 2, 3, 4, 5, 6, 7, 8, 9, 10, 11


